December 7, 2025

Real-Time AI Monitoring: From Reactive Alerts to Proactive Prevention

The Reactive Monitoring Problem

Traditional AI monitoring is reactive. You discover problems after they've already caused damage:

  • Customer complaints about biased AI decisions
  • Regulatory audits revealing compliance violations
  • Security incidents from AI data breaches
  • Performance degradation impacting business operations

By the time you know there's a problem, it's too late.

Real-time AI monitoring shifts from reactive to proactive. It catches issues instantly, prevents incidents before they occur, and enables immediate response.

Real-Time vs. Batch Monitoring

Batch Monitoring (Traditional Approach)

How it works:

  • Collect AI logs and data periodically (daily, weekly)
  • Run batch analysis jobs
  • Generate reports after the fact
  • React to issues days or weeks later

Problems:

  • Delayed detection allows problems to compound
  • No ability to prevent incidents
  • Retrospective analysis only
  • Poor user experience during failures

Real-Time Monitoring (Modern Approach)

How it works:

  • Continuous monitoring of all AI operations
  • Instant analysis and alerting
  • Immediate visibility into system state
  • Proactive prevention of incidents

Benefits:

  • Catch issues within seconds of occurrence
  • Prevent incidents before customer impact
  • Enable instant response and remediation
  • Maintain optimal AI performance

What to Monitor in Real-Time

1. System Health & Performance

Availability Monitoring

  • AI service uptime and responsiveness
  • API endpoint health checks
  • Dependency service status
  • Infrastructure resource utilization

Performance Metrics

  • Response time and latency (p50, p95, p99)
  • Request throughput and concurrency
  • Error rates and failure patterns
  • Resource consumption (CPU, memory, GPU)

Alert Examples:

  • ⚠️ API response time >2 seconds (p95) for 5 minutes
  • 🚨 Error rate >5% for any 1-minute window
  • ⚡ GPU utilization >90% for 10+ minutes

2. Model Performance & Quality

Prediction Quality

  • Model accuracy and F1 scores
  • Confidence score distributions
  • Prediction consistency over time
  • Output quality assessments

Drift Detection

  • Data distribution changes
  • Concept drift in model behavior
  • Feature importance shifts
  • Performance degradation trends

Alert Examples:

  • 📉 Model accuracy dropped 5% from baseline
  • 🔄 Data drift detected in 3+ input features
  • ⚠️ 15% of predictions below confidence threshold

3. Compliance & Governance

Policy Violations

  • Guardrail activations and blocks
  • Data access policy violations
  • Unapproved AI system usage
  • Shadow AI detection

Regulatory Compliance

  • GDPR data processing violations
  • EU AI Act requirement breaches
  • Bias and fairness threshold violations
  • Explainability failures

Alert Examples:

  • 🚫 Content safety guardrail blocked 10 requests in 1 hour
  • ⚖️ Bias metric exceeded fairness threshold
  • 📋 Missing consent for AI processing detected

4. Security & Privacy

Security Events

  • Unauthorized access attempts
  • Data exfiltration patterns
  • Anomalous query patterns
  • Adversarial attack signatures

Privacy Violations

  • PII exposure in AI outputs
  • Unauthorized data access
  • Cross-tenant data leakage
  • Data retention policy violations

Alert Examples:

  • 🔒 Suspected prompt injection attack detected
  • 👤 PII detected in model output
  • 🚨 Unusual data access pattern from AI system

5. Business Metrics

User Experience

  • AI feature adoption rates
  • User satisfaction scores
  • AI-assisted task completion rates
  • User feedback sentiment

Business Impact

  • Revenue influenced by AI recommendations
  • Cost per AI operation
  • ROI tracking for AI investments
  • Conversion rates from AI features

Alert Examples:

  • 📊 AI recommendation acceptance rate dropped 20%
  • 💰 Daily AI costs exceeded budget by 30%
  • 😠 Negative user feedback spike detected

Guardrail Activation Alerts

Why Guardrail Alerts Matter

Guardrails prevent AI incidents by blocking risky outputs. But activations signal important patterns:

  • High activation rates: Input data quality issues, user behavior problems
  • Activation spikes: Attacks, system issues, training data drift
  • Activation patterns: Specific users, data sources, or use cases with problems

Guardrail Alert Types

Content Safety Guardrails

  • 🚫 Toxic content generation blocked
  • ⚠️ Hate speech detection activated
  • 🔞 Inappropriate content filtered

Privacy & Security Guardrails

  • 🔒 PII exposure prevented
  • 🛡️ Prompt injection attack blocked
  • 🔐 Unauthorized data access prevented

Bias & Fairness Guardrails

  • ⚖️ Discriminatory output blocked
  • 👥 Protected class bias detected
  • 📊 Fairness metric violation prevented

Quality & Reliability Guardrails

  • ❓ Low confidence prediction blocked
  • 🤔 Hallucination detected and prevented
  • 📉 Quality threshold violation blocked

Alert Fatigue Prevention

The Alert Fatigue Problem

Too many alerts leads to:

  • Ignored critical alerts
  • Slow response times
  • Team burnout
  • False sense of security

Statistics: Teams receiving >50 alerts/day ignore 90% of them.

Smart Alerting Strategies

1. Severity-Based Routing

  • Critical (P0): Immediate notification via PagerDuty, SMS, phone call
  • High (P1): Slack/Teams notification, email escalation
  • Medium (P2): Dashboard notification, daily digest email
  • Low (P3): Dashboard only, weekly summary

2. Alert Aggregation

  • Group related alerts together
  • Summarize repetitive alerts
  • Provide context and trends
  • Reduce notification noise

Example: Instead of 47 separate "High error rate" alerts, send one alert: "Error rate spike across 3 services (47 occurrences in 10 minutes)"

3. Intelligent Thresholds

  • Dynamic thresholds based on historical patterns
  • Time-of-day and day-of-week awareness
  • Seasonal and trend adjustments
  • Statistical anomaly detection

4. Alert Correlation

  • Link related alerts to root cause
  • Identify cascading failures
  • Suppress downstream alerts
  • Surface primary issue

Incident Response Automation

Automated Remediation

When alerts fire, AI Governor can automatically respond:

Performance Issues

  • Scale infrastructure resources
  • Reroute traffic to healthy instances
  • Enable caching and rate limiting

Security Incidents

  • Block malicious IP addresses
  • Disable compromised accounts
  • Trigger security scans

Compliance Violations

  • Disable non-compliant AI systems
  • Notify compliance team
  • Generate incident reports

Incident Workflows

Automated Incident Creation

  1. Alert fires based on threshold violation
  2. AI Governor creates incident ticket
  3. System gathers context and diagnostics
  4. Incident assigned to on-call engineer

Investigation Support

  • Related logs and metrics automatically attached
  • Similar historical incidents linked
  • Runbooks and playbooks suggested
  • Collaboration channels created

Resolution Tracking

  • Time to detect, time to respond tracked
  • Root cause analysis documentation
  • Post-incident reviews and learnings
  • Preventive measure recommendations

Integration with Communication Tools

Slack Integration

Alert Notifications

  • Critical alerts to #ai-incidents channel
  • Service-specific alerts to team channels
  • Rich formatting with metrics and charts
  • Action buttons for quick response

Interactive Commands

  • /ai-status - Current system status
  • /ai-incidents - Open incidents
  • /ai-metrics - Key performance metrics

Microsoft Teams Integration

Adaptive Cards

  • Interactive alert cards with context
  • Incident acknowledgment buttons
  • Metric charts and trends
  • Quick actions (investigate, escalate, resolve)

Email Notifications

Smart Email Alerts

  • Severity-based email routing
  • Digest emails for low-priority alerts
  • HTML-formatted with charts and links
  • One-click actions from email

Dashboard & Visualization

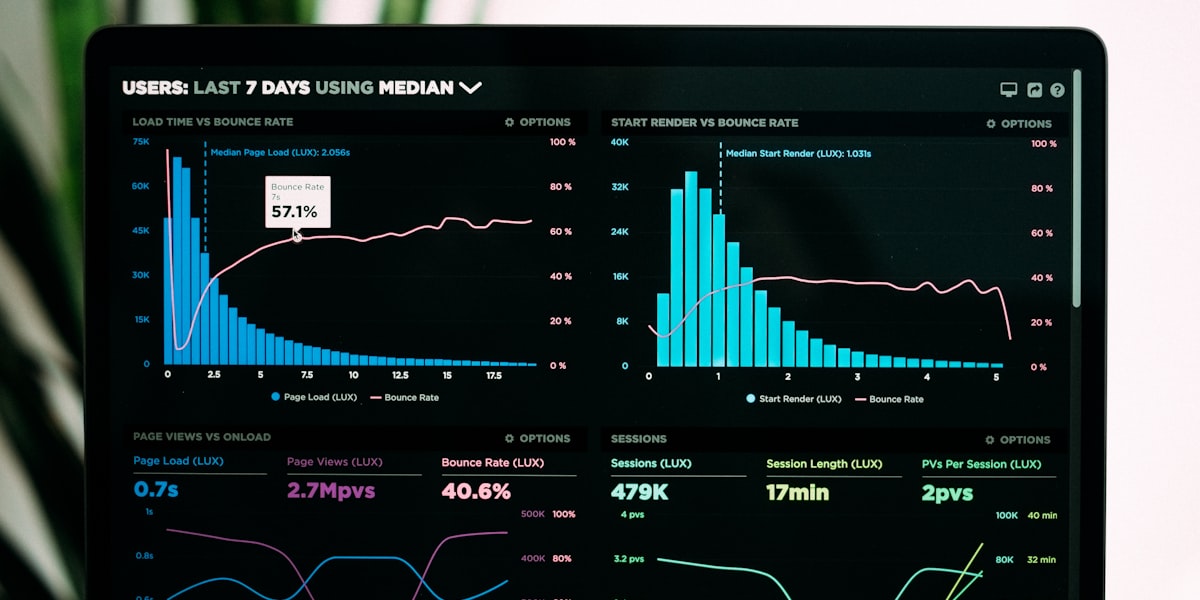
Real-Time Monitoring Dashboard

Executive View

  • Overall AI health score
  • Active incidents and severity
  • Key performance indicators
  • Compliance status summary

Operations View

  • Service health and availability
  • Performance metrics and trends
  • Error rates and latency
  • Resource utilization

Compliance View

  • Guardrail activation patterns
  • Policy violation trends
  • Regulatory compliance metrics
  • Audit trail and evidence

AI Governor's Real-Time Monitoring Solution

Comprehensive Monitoring Coverage

Monitor everything in one platform:

  • ✅ System health and performance
  • ✅ Model quality and drift
  • ✅ Compliance and governance
  • ✅ Security and privacy
  • ✅ Business metrics and ROI

Instant Alerting

Get notified the moment issues occur:

  • Sub-second alert detection
  • Multi-channel delivery (Slack, Teams, email, PagerDuty)
  • Smart alert routing based on severity
  • Alert aggregation and correlation

Automated Response

Respond to incidents automatically:

  • Pre-defined remediation playbooks
  • Automatic incident ticket creation
  • Infrastructure auto-scaling
  • Security response automation

Interactive Dashboards

Visualize AI health in real-time:

  • Customizable monitoring dashboards
  • Drill-down into specific metrics
  • Historical trend analysis
  • Export and reporting capabilities

Real-World Success Story

Global E-Commerce Platform - AI Monitoring Transformation

Before AI Governor:

  • Daily batch monitoring with 24-hour lag
  • Average 8-hour mean time to detect (MTTD)
  • Multiple customer-reported AI failures per week
  • No guardrail visibility

After AI Governor:

  • Real-time monitoring with <1 minute MTTD
  • Zero customer-reported AI incidents
  • 92% of issues caught before customer impact
  • Complete guardrail activation visibility
  • 75% reduction in incident response time

Prevention is Better Than Reaction

Real-time AI monitoring transforms how you manage AI systems. Instead of reacting to problems after they occur, you prevent them before they impact users.

AI Governor's real-time monitoring provides complete visibility, instant alerts, and automated response for enterprise AI systems.

Stop reacting. Start preventing.

Trushar Panchal, CTO

🚀 Implement Real-Time AI Monitoring

Get complete visibility into your AI systems with instant alerts and automated response capabilities.

Get Your Free Monitoring Assessment →

Explore the Complete AI Governance Framework

This guide covered real-time AI monitoring. For deeper dives into related topics, explore our detailed blog posts:

🎯 Ready to Achieve AI Governance Maturity?

Start with a free AI governance maturity assessment, gap analysis, and custom implementation roadmap.

Get Your Free Assessment & Roadmap →

heading 3

heading 4

The rich text element allows you to create and format headings, paragraphs, blockquotes, images, and video all in one place instead of having to add and format them individually. Just double-click and easily create content.

  • Establish a baseline across all business-critical capabilities
  • Conduct a thorough assessment of operations to establish benchmarks and set target maturity levels